- B2B Growth Insights
- Posts
- BTS: How We Track $10M in Competitor Ad Spend
BTS: How We Track $10M in Competitor Ad Spend
How to See What Competitors Are Spending

Super excited for the next few months, where after a lot of requests and a recent acquisition to help us better fulfil demand we’re going to be opening up our consulting again soon, with the single best value offer EVER.
Can’t wait to be working with more readers here but for the moment I want to share a tactic that after 14 months we’re finally able to go public with.

🕵️🔍 BTS: How We Track $10M in Competitor Ad Spend
In this article, I'm giving you a behind-the-scenes look at tens of millions in YouTube ad spend data we've collected, plus the exact steps for how we gather this intelligence so you can build your own version for free.

We ended up building a system that monitors individual ad performance across dozens of companies, tracking millions in competitor ad spend and discovering which creative approaches actually drive results.
The insights completely changed how our client approaches YouTube advertising. Their return on ad spend jumped from 1.8x to 4.9x, and they scaled their monthly ad budget from $12k to over $150k.
But the real discovery wasn't just about the numbers. It was about what those numbers revealed about which creative approaches actually work—and which expensive, high-production ads are just burning money.
The Student vs. Professional Ad Paradox
Here's what caught our attention first: Grammarly was spending dramatically different amounts on ads that looked almost identical.
We tracked 50+ Grammarly ads over the past year and noticed something counterintuitive. Their highest-spending ads—the ones receiving 60-70% of their entire YouTube budget—weren't always the polished, high-production campaigns you'd expect. They were simple customer testimonial videos, many shot in bedrooms or dorm rooms.

Grammarly’s Ads
Meanwhile, their professionally produced ads with studio lighting, scriptwriters, and professional actors were getting comparatively tiny budgets. Some of these expensive productions received less than $10k in spend while a simple testimonial from a medical student talking about how Grammarly helped with research papers accumulated over $300k in spend.

When we looked at the targeting data, we started to understand why. For student audiences, authenticity trumped production value every time. The bedroom testimonials felt native to the platform, they looked like regular YouTube content, not ads. This reduced ad fatigue and increased trust because the message came from a peer, not a brand.
For professional audiences, the opposite was true. The studio-produced ads emphasizing workplace pain points ("feeling underwater with workload") performed significantly better than casual testimonials.
The 80/20 Rule of Ad Spend
As we tracked more companies, a consistent pattern emerged across every brand we monitored. The top-performing 10-20% of ads consistently received 60-70% of the total advertising budget.

YouTube's algorithm shows ads to users, but marketing teams decide where to spend their budgets. They allocate more money to ads that drive the greatest results—higher conversion rates, better cost per acquisition, stronger return on investment.
What this means: Ad spend is the most accurate public indicator of creative performance. If a company is pouring hundreds of thousands of dollars into a specific video, it's because that video is making them money.
Most companies running competitive analysis focus on what their competitors are saying or how their ads look. We realized they should be focusing on how much their competitors are spending.
How We Collect the Data
While we can't offer this tracking system to everyone (it's part of our consulting service), I want to give back to readers of this newsletter by showing you exactly how we built it. The methodology is straightforward enough that you can replicate the core functionality yourself.
Most competitor ads are unlisted, so you can't just browse a company's YouTube channel to see their advertising creative. Instead, we visit the target company's website. When this happens, their retargeting pixel fires and tells YouTube's algorithm that we're a qualified prospect who should see their ads.

Within 24-48 hours, we start seeing their YouTube ad campaigns in our feed.
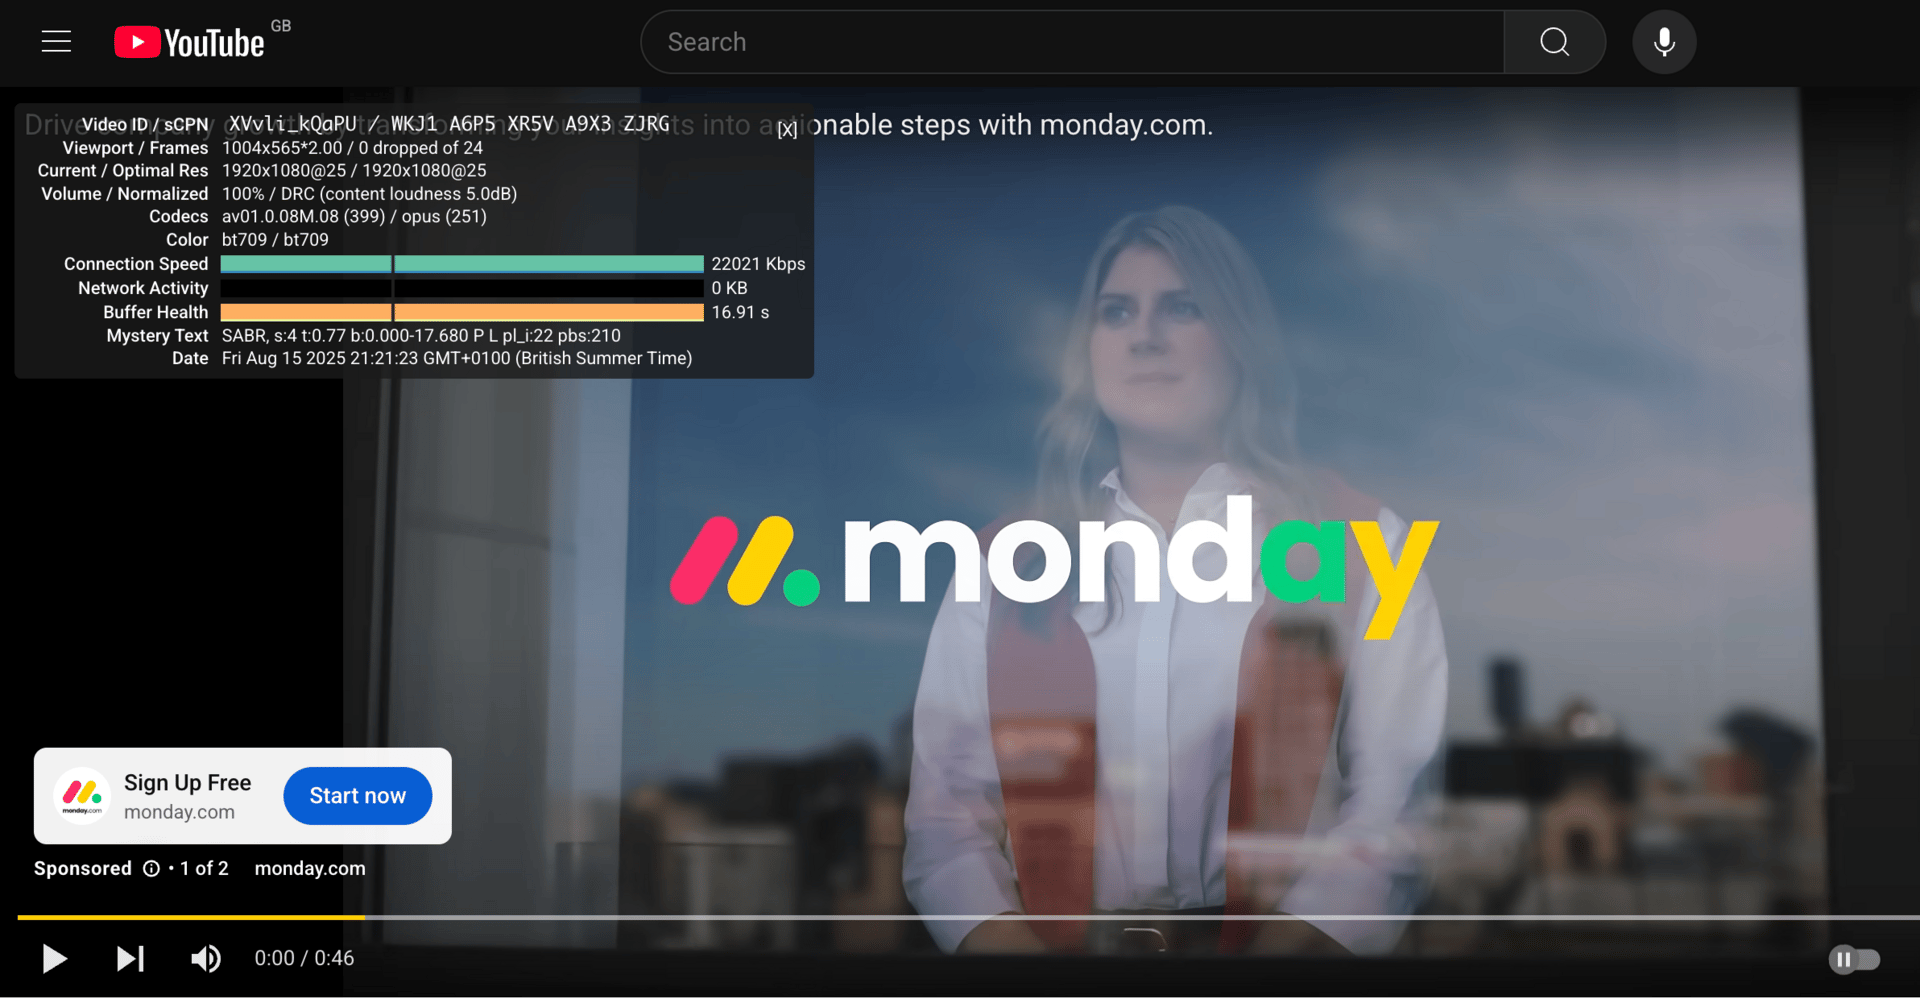
When we spot a competitor ad, we pause the video, right-click, and select "Stats for nerds" from the dropdown menu. This reveals the video ID—a unique identifier for every YouTube video.

We then navigate to the direct video URL: youtube.com/watch?v=[VIDEO_ID]. This shows us the public view count and upload date for the ad.

We built a system that calls YouTube's API daily at 8pm to collect updated view counts for every ad we're monitoring. Since we've been tracking these ads for months, we can calculate daily view velocity—how many new views each ad is generating.
We developed a machine learning algorithm that factors in targeting parameters (audience size, demographics, geography) to estimate the cost-per-thousand-impressions (CPM) for each ad. We backtested this against actual CPM data from a dozen clients across different audience types and found our estimates accurate within 15-20%.
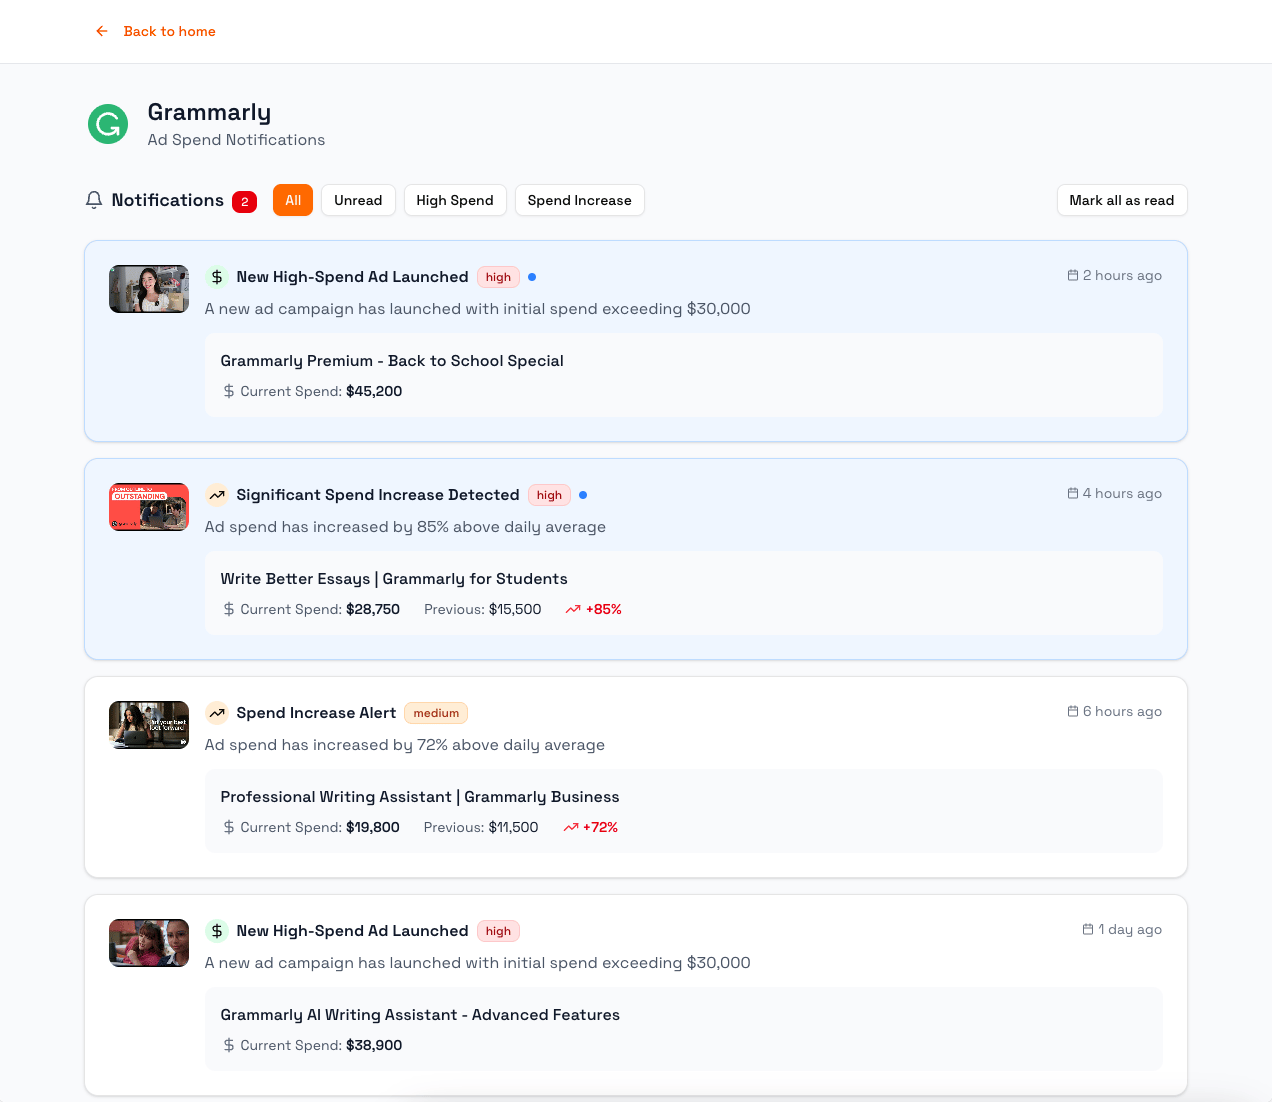
The system sends alerts when a new ad launches with spend exceeding $30k, or when an existing ad suddenly increases spend by 60% or more above its usual daily average. These alerts often signal that a company has discovered a winning creative formula.

What the Data Revealed
After tracking dozens of companies and millions in ad spend, several patterns became impossible to ignore.
Pattern 1: Authentic Performance Customer testimonials and user-generated content consistently outperformed professionally produced ads, especially for consumer-facing products. The exception: B2B software, where polished production values signaled credibility to enterprise buyers.
Pattern 2: Hook Dominance The first 3-5 seconds determined everything. Ads with immediate, specific value propositions ("Here's how I got A's in medical school") vastly outperformed generic openings ("Struggling with writing?").
Pattern 3: Feature Education Grammarly's most successful ads weren't about basic grammar checking—they showcased premium features through customer stories. Users explaining advanced features like tone detection or plagiarism checking drove upgrade conversions while appearing helpful rather than promotional.
Pattern 4: Platform-Native Creative Ads that looked like regular YouTube content (talking head testimonials, screen recordings, casual setups) received significantly more budget allocation than ads that screamed "this is an advertisement."
Client Results
Return on ad spend improved from 1.8x to 4.9x within four months enabling them to scale their monthly ad budget from $12k to over $150k.
More importantly, they stopped guessing. Every creative decision now had competitive intelligence backing it up.
Take a Look Inside
As an extra thank you to the loyal readers if you'd like to explore the platform, I've opened up access to one of our demo portals. You can browse ad spend data from Grammarly, Microsoft, Adobe, Framer, HubSpot, Wix, and several other major brands.
No signup required, just use password "PRICEPOINT25" to access the dashboard.